Using ggplot - Bar Plots
Introduction
A bar plot uses rectangular bars (like a histogram) to represent data that is grouped into a series, sized accordingly based on the numerical value associated with it. The rectangular bars can be displayed either vertically or horizontally.
Basic Example
First, we must gather our data. For this example, we will gather the number of home runs a team hit in 1980. For this purpose, we are ordering the results by the number of home runs hit.
#import libraries
library(Lahman)
library(dplyr)
library(ggplot2)

#store data into a variable named df
df<-Teams %>%
  filter(yearID==1980) %>%
  select(name, HR) %>%
  arrange(HR)
Using ggplot, we’ll display the data with a simple bar plot. By using stat=“identity”, we are telling ggplot NOT to tally up the data. We have already performed that math in our original query.
ggplot()+
  geom_bar(data=df, aes(x=name,y=HR),stat="identity", color="green", fill="white")+
  ggtitle("HR by team in 1980")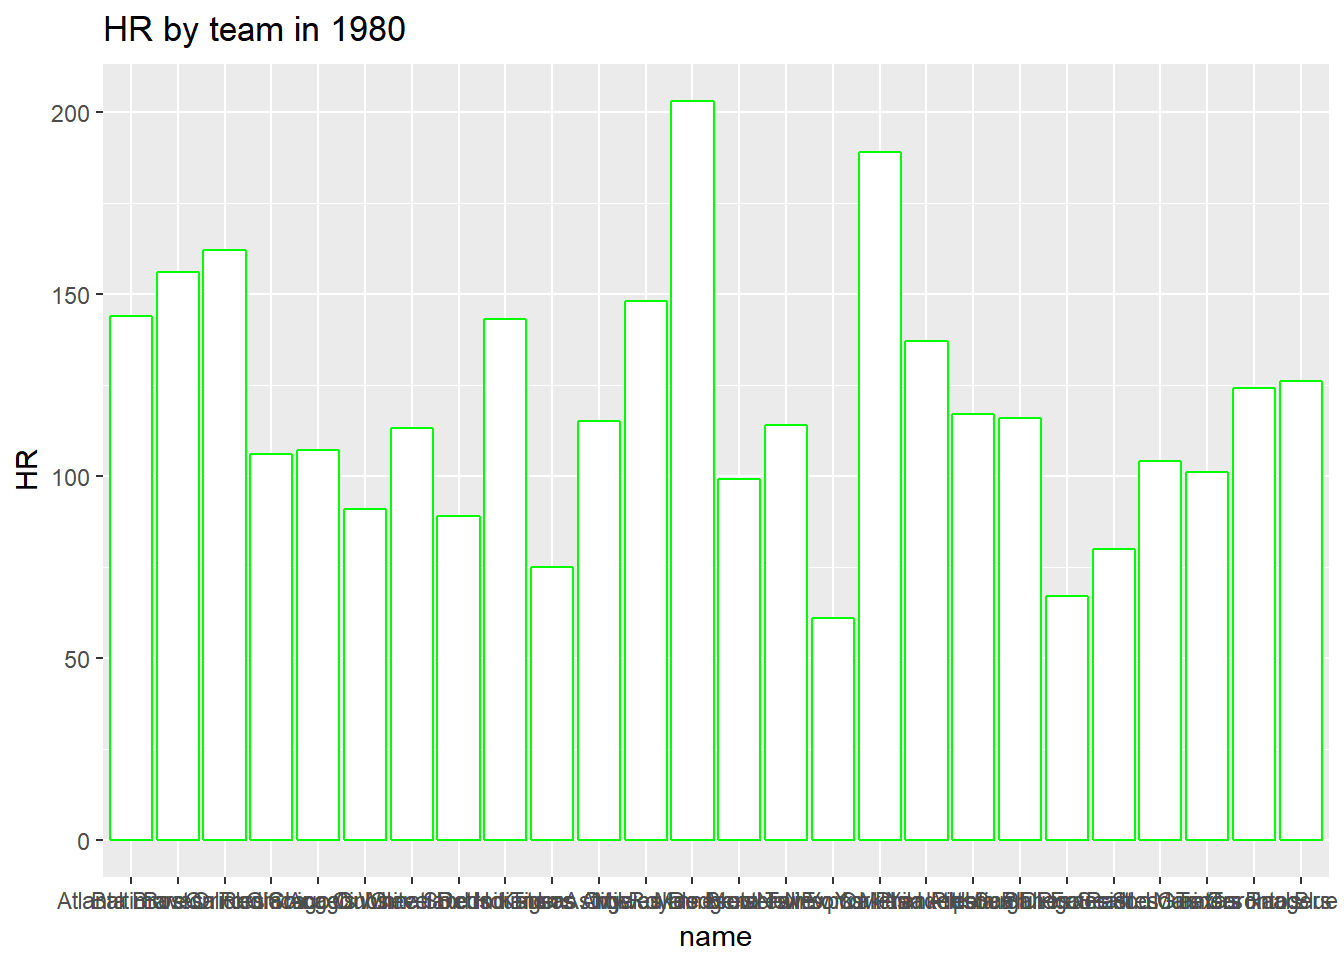
Now, in the x-axis, the names of the teams are very hard to read, so let’s flip the coordinates, so that we can read them better, by using coord_flip().
ggplot()+
  geom_bar(data=df, aes(x=name,y=HR),stat="identity", color="green", fill="white")+
  ggtitle("HR by team in 1980")+
  coord_flip()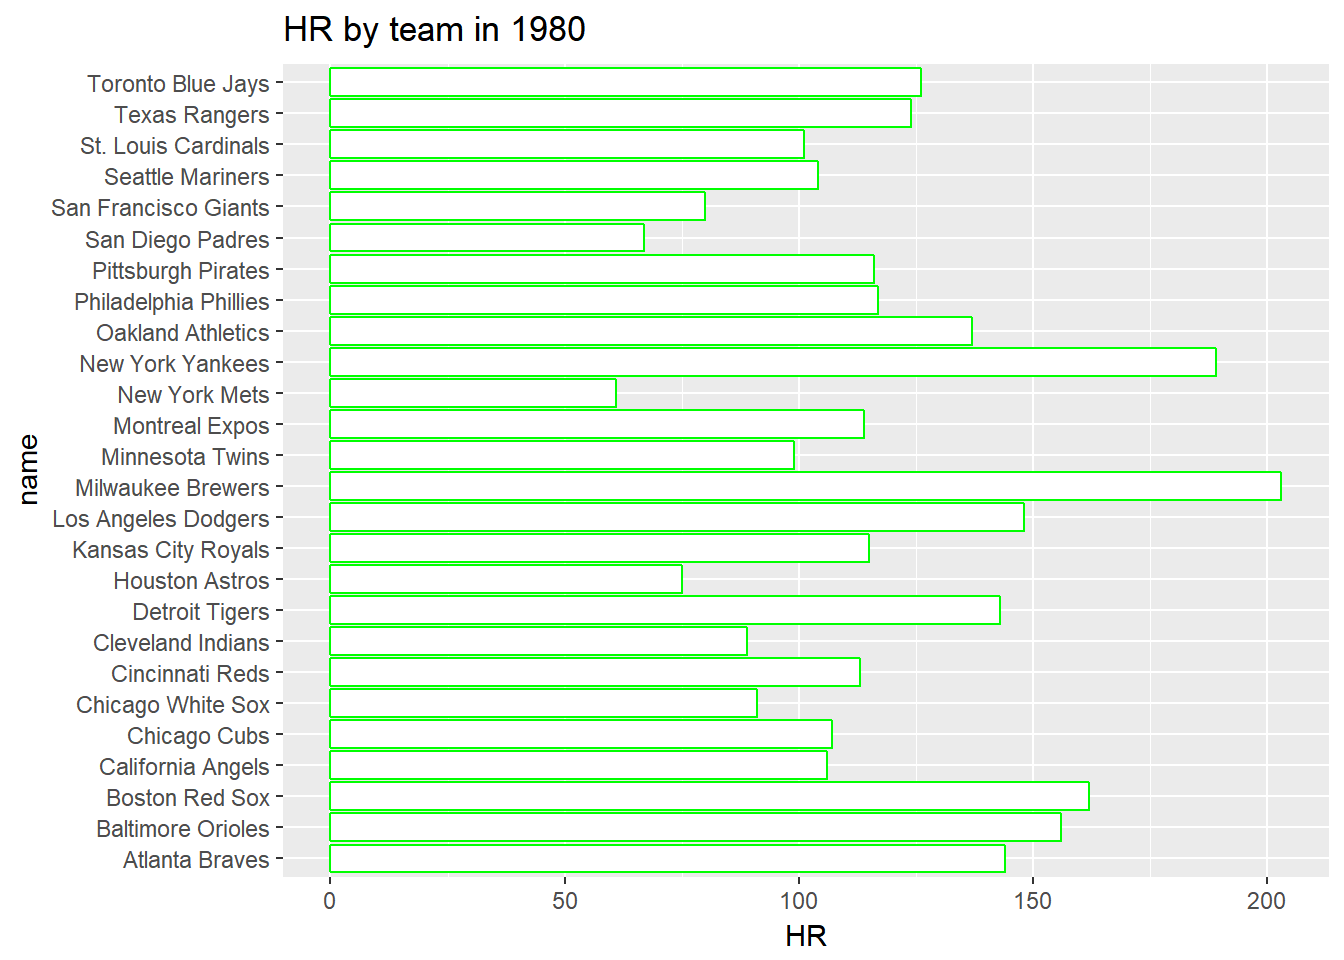
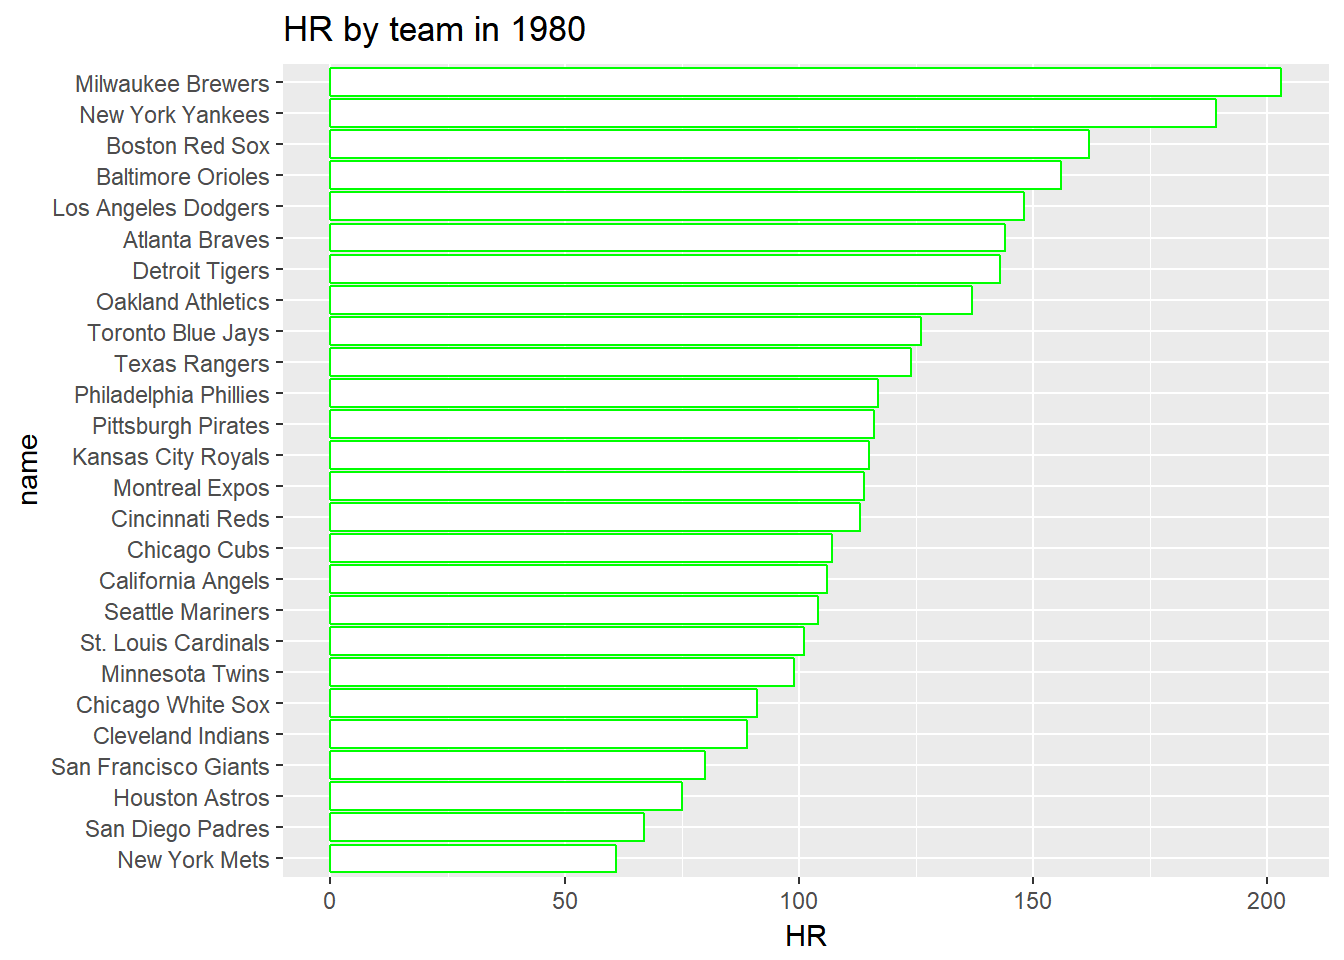
Here you will see that the data isn’t ordered the same as our original query. To make this chart easier for the user to visualize, we want the bars to match what we have in our query. To do this, we must change the data type of the ‘name’ field. Simply changing the type to a factor isn’t enough. We need to set the levels to match what was in our original query.
str(df$name) # this will show us the current data type of the column (e.g. "chr")## chr [1:26] "New York Mets" "San Diego Padres" "Houston Astros" ...#change this to a factor and save it back to the dataset.
df$name<-factor(df$name,levels=df$name)Now we can see our new chart in a better order.
ggplot()+
  geom_bar(data=df, aes(x=name,y=HR),stat="identity", color="green", fill="white")+
  ggtitle("HR by team in 1980")+
  coord_flip()